There are three categories (Agile Reports, Issue Analysis Reports & Forecast & Management Reports) of JIRA reports. Issue Analysis Reports can be further subdivided into the below-mentioned sub-categories.
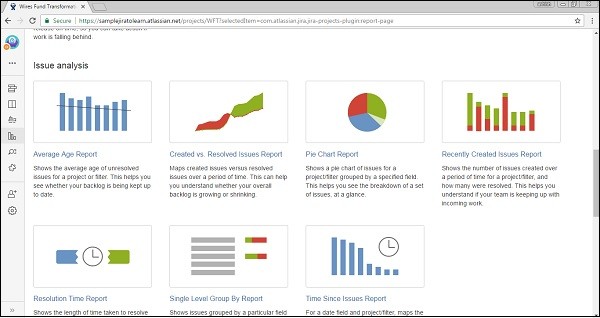
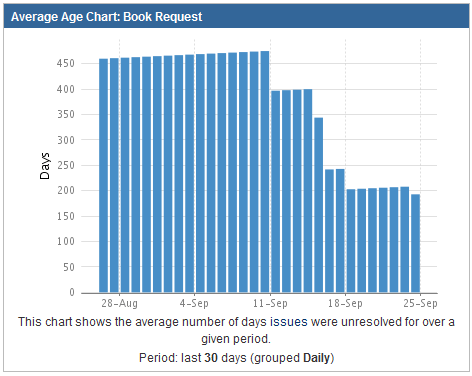
Average Age Report − Displays the average age in days of unresolved issues.
Created Vs Resolved Issue Report − Display the number of issues created vs the number of issues resolved in the given period.
Pie chart Report − This shows a pie chart of issues for a project grouped by a specified field.
Recently Created Issue Report − Shows the number of issues created over a time period for a project and how many of those were resolved.
Resolution Time Report − Displays the average time taken to resolve issues.
Single Level Group by Report − It helps to group the search results by a field and see the overall status of each group.
Time since Issues Report − It helps to track how many issues were created, updated, resolved, etc., over a time period.
Issue Analysis: Average Age Report
The Average Age report is a bar chart showing the average age (in days) of unresolved issues at given points in time for a project. The report is based on your choice of project or issue filter, and your chosen units of time (ie. hours, days, weeks, months, quarters or years). This helps you see whether your backlog is being kept up to date.
Explanation
In this report for every issue, we:
- extract the creation date and resolution date
- iterate over a list of contiguous time buckets (configurable by hour, day, month or year)
IF the issue creation date is before the start of the period and the resolution date is after the start of the period We then compute the amount of time the issue has been opened up to the end of this period using min(resolutionDate, periodEndDate) – issueCreationDate and increment a count of open issues for that period.
The result is a map of periods to the total time that the issues have been opened. We compute the average by dividing the total time by the total number of issues recorded per period.
Generating an Average Age Report
- Navigate to the desired project.
- Choose Summary (tab) > Reports section > Average Age Report.
- Choose the desired filter/project.

- In the Period field, select the timeframe on which the report will be based.
- In the Days Previously field, enter the number of days’ worth of data (counting backwards from today) to be included in the report.
Issue Analysis: Created Vs Resolved Issue Report
Jira delivers the relevant information in a convenient format called reports. Resolved vs Created Issues Report displays the number of issues created vs number of issues resolved over a given period of time. This report is based on the project or issue filter that the user chooses and the chart can be either cumulative or not. It helps to recognize whether the overall backlog is moving towards resolution or not.
Steps for generating Resolved vs Created Issues Report
The report generated will look like given below
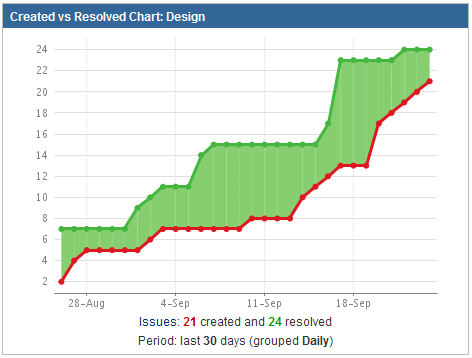
The created issues are displayed in RED, while the resolved issues are in GREEN color.
Below are the steps for creating Resolved vs Created Issues Report
- Navigate to the desired project.
- Choose Summary (tab) > Reports section > Created vs Resolved Issues Report.
- Click Select Filter or Project.
- The popup Filter or Project Picker will appear. Select the project, or issue filter, in which you are interested. You will then be returned to the form.
- Period field, select the timeframe (Hourly, Daily, Weekly, Quarterly or Yearly) on which the report will be based:
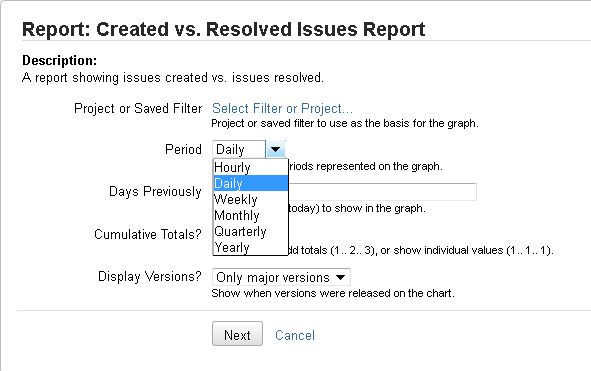
- Days Previously field, enter the number of days’ worth of data (counting backwards from today) to be included in the report.
- Cumulative Totals? field, choose either:
- Yes to progressively add data to the preceding column; or
- No to show just a single value in each column.
- Display the trend of Unresolved? field, choose either:
- Yes to show the number of unresolved issues over time in a subplot; or
- No otherwise.
- Display Versions? field, choose either:
- All versions to show version release dates on the chart, for all released versions; or
- Only major versions to show version release dates on the chart, for released versions that are named ‘x.x’ only; or
- None to not show version release dates on the chart.
Issue Analysis: Pie Chart Report
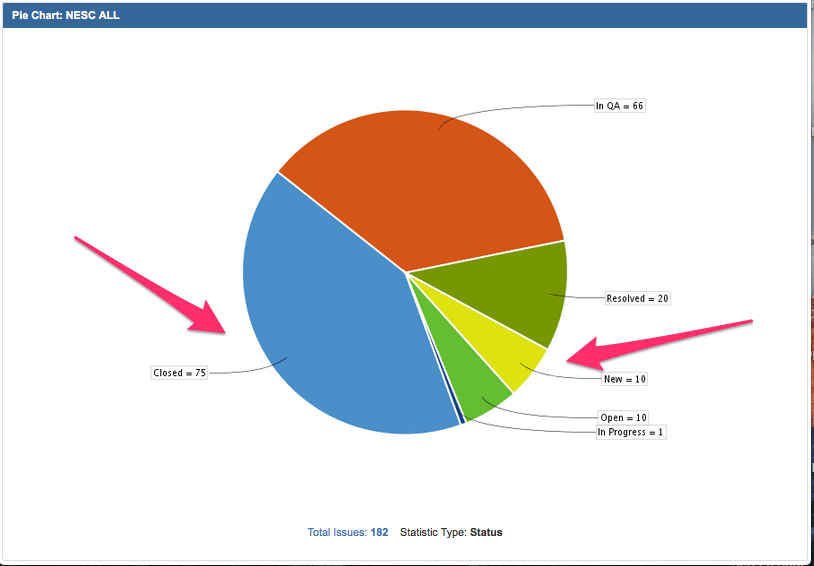
JIRA has many built-in reports which serve multiple needs, Pie Chart Report is one of those. Existing JIRA pie reports are good features but sometimes there is a special need to write different pie charts. The ‘Pie Chart’ displays issues returned from a specified project or issue filter, grouped by a specified field (issue status, priority, assignee, and more).
Examples
- Display a pie chart that shows the distribution of issues based on status over a given period of time. In these scenarios Pie Chart Report comes very useful.
- An issue filter can be created to retrieve all open issues for a particular version of a particular project. Display these issues grouped by a specified field (e.g. Assignee).
- Displays all relative workload for assignees (to which issues are assigned) of all issues in a particular project.
The report generated will look something like this:
Generate a Pie Chart report
- On the top navigation bar, click on the “Projects” drop down. The projects drop-down will display. NOTE: If you click on the “Projects” link instead of the drop-down, the summary page of your current project will display.
- Click on the project that you want to browse else click on the “View All Projects” (list of all projects in your JIRA instance will display) and select your project from there.
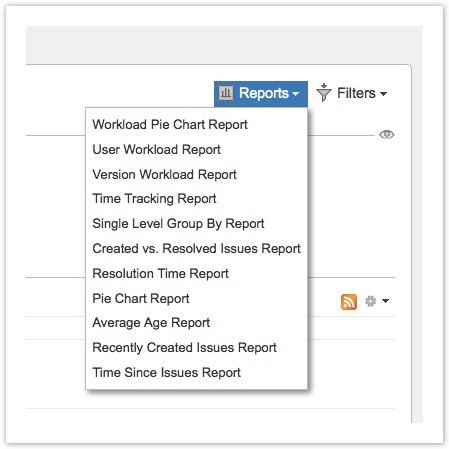
- Click on the “Reports” dropdown menu on the right side of the page and click on the “Pie Chart Report” from the drop-down menu that displays.
- Select the project or saved filter for which the user wants to generate a Workload Pie Chart report.

- In the “Statistic Type” drop-down list, select the field on which the pie chart will be based. By default Assignee is selected.
- Click on the “Next” button to generate the report.
Issue Analysis: Recently Created Issues Report
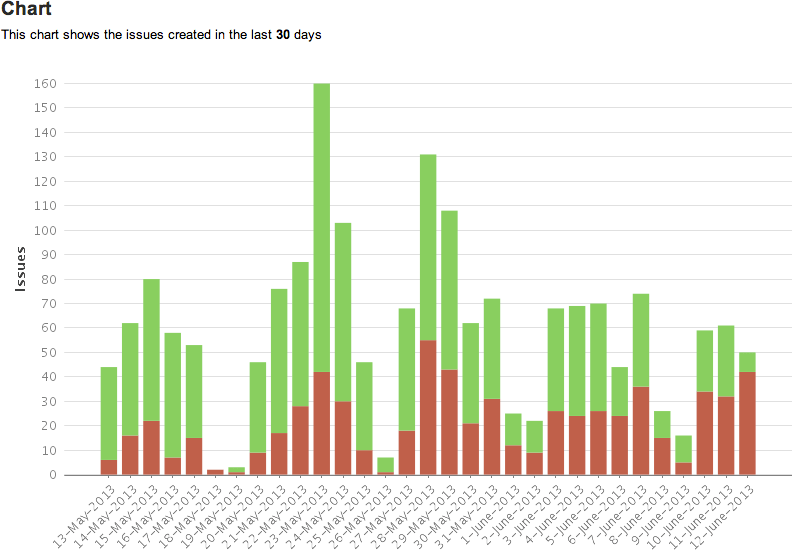
The ‘Recently Created Issues‘ report is a bar chart showing the rate at which issues are being created, as well as how many of those created issues are resolved. The report is based on your choice of project or issue filter, and your chosen units of time (ie. hours, days, weeks, months, quarters or years). This helps you understand if your team is keeping up with incoming work.
- Navigate to the desired project.
- Choose Summary (tab) > Reports section > Recently Created Issues Report.

- Choose the desired filter/project.
- In the Period field, select the timeframe on which the report will be based:
- In the Days Previously field, enter the number of days of data (counting backwards from today) to be included in the report.
Issue Analysis: Resolution Time Report
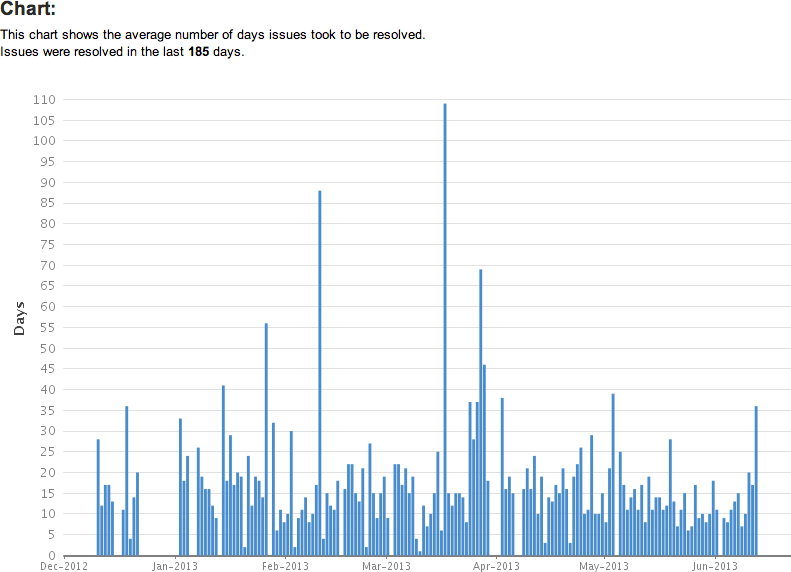
The ‘Resolution Time’ report is a bar chart showing the average time taken to resolve issues. This is useful to show you the trends in resolution time. The report is based on your choice of project or issue filter, and your chosen units of time (ie. hours, days, weeks, months, quarters or years).
- Navigate to the desired project.
- Choose Summary (tab) > Reports section > Resolution Time Report.

- Choose the desired filter or project.
- In the Period field, choose the timeframe on which the report will be based.
- In the Days Previously field, enter the number of days of data (counting backwards from today) to be included in the report.
Issue Analysis: Single Level Group By Report
The Single Level Group By report displays issues returned from a specified issue filter of your choice, grouped by a specified field. For example, an issue filter can be created to retrieve all open issues for a particular version of a particular project. The Single Level Group By report can then be used to display these issues grouped by a specified field (e.g. Assignee).
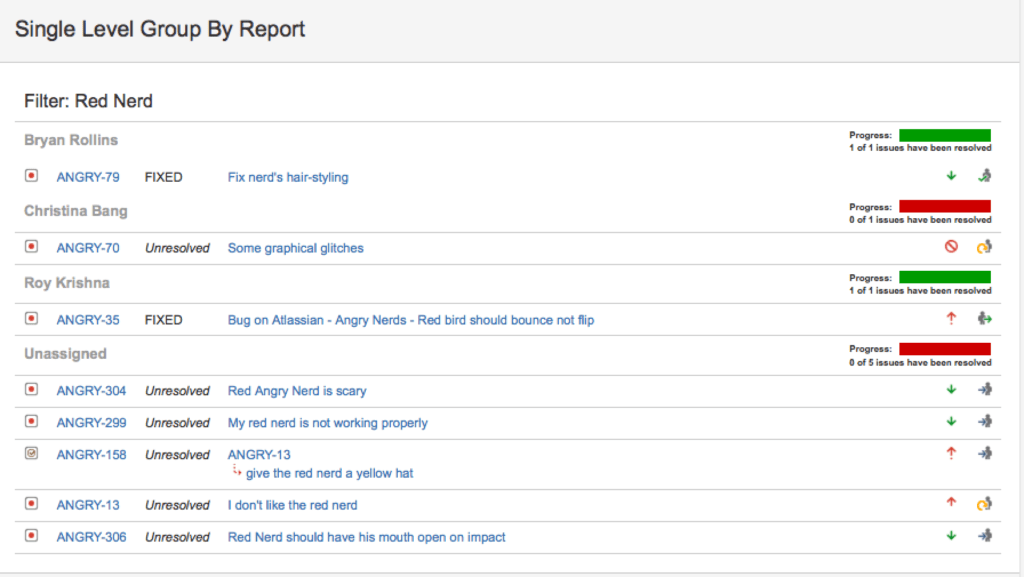
- Navigate to the desired project.
- Choose Summary (tab) > Reports section > Single Level Group By Report.
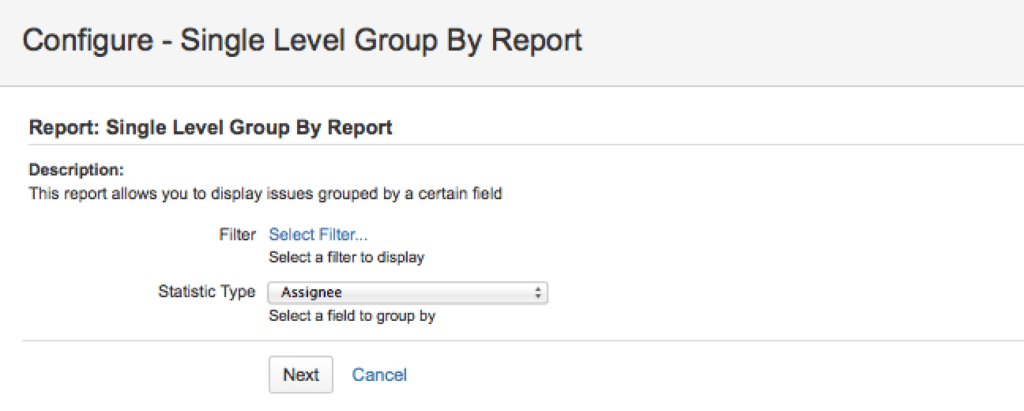
- Select the desired issue filter.
- In the Statistic Type field, select the field by which the report will group the issues returned from your chosen issue filter.
Issue Analysis: Time Since Issues Report
The ‘Time Since Issues’ report is a bar chart showing the number of issues for which your chosen date field (e.g. ‘Created’, ‘Updated’, ‘Due’, ‘Resolved’, or a custom field) was set on a given date. The report is based on your choice of project or issue filter, and your chosen units of time (ie. hours, days, weeks, months, quarters or years)
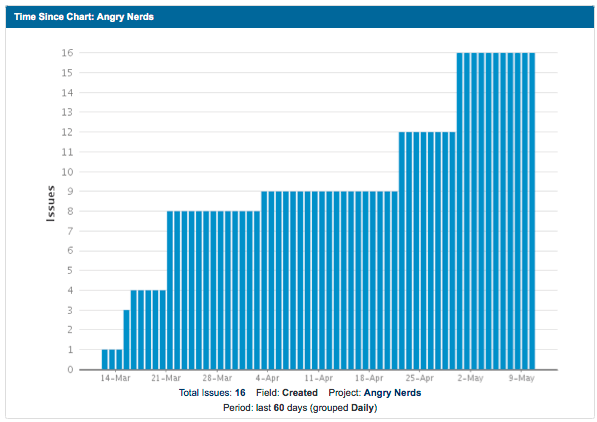
- Navigate to the desired project.
- Choose Summary (tab) > Reports section > Time Since Issues Report.
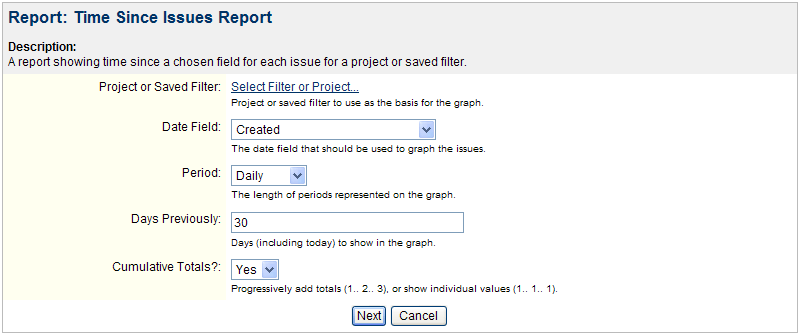
- Choose the desired project/filter.
- In the Date Field field, select the desired date. Note, only available if time tracking has been enabled by your JIRA administrator.
- In the Period field, select the timeframe on which the report will be based.
- In the Days Previously field, enter the number of days of data (counting backwards from today) to be included in the report.
- In the Cumulative Totals? field, choose either:
- Yes to progressively add data to the preceding column; or
- No to show just a single value in each column.
Recommended Reading
- Scrum Board – Create & Customize for Scrum Team
- Kanban Board – Create & Customize for Kanban Team
- Scrum Board – Tips and Tricks for JIRA
- JQL functions – Advanced searching in JIRA
- JIRA Structure – Create & Manage Epics and Stories
- Bulk Jira Issue creation using CSV Template
- JIRA Reports use in tracking Agile Projects
- Sprint ID for an Active or Closed Sprint
- Text Field search using advanced search in JIRA
JIRA Reference: Click Here
